
How are Journals Ranked: Part One
A handy guide to Journal Rankings!
We make everything into a competition. From children’s sports days to cheese rolling (google it, trust me), we can’t seem to help ourselves from adding a little competitive spirit to things.
Journal publishing is no different. Scientific journals, medical journals, social science journals, the field doesn’t matter; no fields are excluded from the competitive process. There are also several methods of ranking journals.
Google Scholar, Clarivate Analytics’ Journal Impact Factors, Scopus’ CiteScore, Altmetric, and many more.
All measuring citations or online engagement, and all providing journals with a ranking in one form or another. We’ll be breaking down some of the main ones in this two-parter blog post and explaining a little of the pros and cons of each journal ranking yardstick!
Google Scholar
I’m starting this list with Google Scholar, which might cause some raised eyebrows from the publishing know-it-alls among you because it is technically not a platform that ranks journals. Nay nay, Google Scholar ranks people!
Now before we descend into some sort of dystopian world of ranking people, I should clarify that Google Scholar profiles published authors, collates their “Quotes” and calculates an author’s “H-index”. I realise that I’ve just thrown a whole bunch of words at you without explaining what they mean, but bear with me. “Quotes” are Google Scholar’s version of citations, and “H-index” is a way to measure an author’s performance based on the number of articles they have published and the number of citations those articles have received. But I digress. In Google Scholar the author receives a snazzy profile that shows their performance over time, as well as highlighting their top articles.
The reason why I’m including Google Scholar in this list (aside from the hope of a fantastic SEO position on Google), is because it is a giant when it comes to engagement with journals, research and researchers. This list would feel a little lost without mentioning the behemoth that is Google Scholar!
Pros:
It’s massive, the dataset is absolutely huge. Pretty much every online research article in the world is indexed in Google Scholar, which means it’s extremely comprehensive.
Cons:
Well, technically it doesn’t rate journals. Although I expect they’re working on that. Also the dataset is so big, it can sometimes be inaccurate.


Scopus
Scopus is owned by the publishing giant Elsevier and claims to be the ‘largest abstract and citation database of peer-reviewed literature.’ And to be fair to Scopus, it is a big and accurate database.
Helpfully, it collates information on individual articles, researchers and journals, so it’s a sort of one-stop-shop for information. Frustratingly, and in true closed access style, this information is partly stuck behind a paywall. There are some free features though, provided that you give your data willingly to Elsevier by creating a “free” author profile (goodbye data, hello spammy emails). You can also see some limited journal rankings and metrics for free without registering, which is nice! Looking for article level information? Dig out your bank card.
Scopus also offers its own “yard stick” as such for ranking journal performance: CiteScore. It’s similar to the Impact Factor (which we’ll touch upon later), in that it takes the number of citations in a single year and compares this to documents published in previous years (for CiteScore, this is the previous 3 years). Very similar to the way Impact Factor is calculated (see part 2 of this blog post coming soon), except it’s based on 3 previous years of published content rather than 2, ground-breaking I know. This small step is important though, because it signals a small (oh so small) step away from the long-held tradition of only measuring journal performance using the Impact Factor
Pros:
Scopus provides some really nice metrics and graphs in their journal profile breakdowns, and is super transparent about how the CiteScore is calculated. The author profiles also add a second dimension, which helps when you need to understand more about who is publishing in specific journals.
Cons:
Subject categories are quite limited. Take the ‘Surgery’ category for example. That’s it, just ‘Surgery’. There’s a whole lot of different types of surgery and I’m sure that those interested in heart surgery for example, maybe aren’t interested in plastic surgery (don’t trust me with your surgical needs), and visa versa! Also, if you want to really drill down into what articles are contributing to the journal rankings, well you’re out of luck, unless you have paid for access or are a member of an institution that has access.
Dimensions
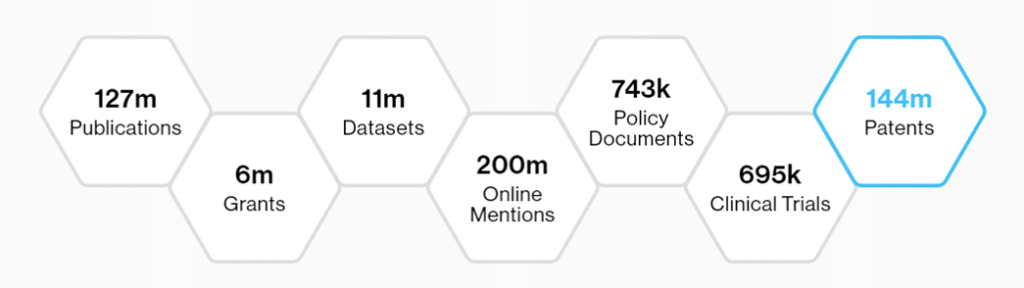
Dimensions is a product owned by Digital Science, which has brought the publishing world some great products including Altmetric (also helpfully profiled in this article). I really Dimensions for several reasons, the first is that it is true to its tagline as ‘The world’s largest linked research information dataset.’ This is starting to sound like an ad, I promise, no ad here, just my genuine thoughts! It doesn’t just have journals, oh no, it has grants, patents, clinical trials, policy documents, even online mentions. It really has gone the extra mile to cover all the bases.
I like the fact it hasn’t tried to brand a new “yard stick”, but it does have some genuinely helpful ratio metrics, like the Field Citation Ratio (FCR). The FCR (according to Dimensions) ‘indicates the relative citation performance of a publication when compared to similarly-aged articles in its subject area.’ Yes, it’s based on citation performance again, but what’s interesting about it is that the FCR “average” is set to 1.0 and it’s averaged at 1.0 for every field. So if the FCR for a surgery journal (for example) is above 1.0, that means the journal is above average within the surgery field. If it’s an Earth Sciences journal (another example), 1.0 is still the same base level to measure from. Other metrics don’t do this, for example an Impact Factor is not set against the context of the field, so an Impact Factor of 1.0 may either be amazing or terrible in the journal rankings, without knowing the context of the rest of the rankings, it’s hard to know for sure.
Pros:
There’s a free version for personal use – hooray! It also has some really amazing insights, I could spend hours (and probably have) perusing their cool graphs and datasets.
Cons:
They have a much wider range of subject categories, but these could be even more detailed. I also really like the fact that you can export the data for visualisation software, but I have found that the software hasn’t caught up to process the larger datasets Dimensions has to offer.
Stay tuned for part 2!
Share Post
Thanks for stopping by my blog today. Make sure you subscribe for more exciting posts about the world of journal publishing!
To support this blog, please enter your email and click on the subscribe button to show me your support and keep up to date with my latest posts.
If you have any questions, drop them in an email! I love a chat!
